InnoFaith – 3D.js front-end for embedded devices

SVG vector bases, touchscreen enabled, animated, and 3D.js driven front-end, running on an “embedded” Raspberry-Pi that is sampling 21 USB connected skin moisture sensors (each containing an array of 256×300 sample points).

3D.js SVG front-end data visualisation

The system is running battery power in a bag pack, carried by the human test subject. De system is hosting a live measurement data as a web service using a Wifi AP hosted by WiFi USB dongle connected to the Raspberry Pi, in connection with the 21 USB connected skin moisture sensors.

3D.js SVG front-end status visualisation

System status (including the external battery) can also be monitored through the same web interface (running fullscreen on a iPad).

InnoFaith – AVEAL 210/220 iOS App

Skin care consultation suite for Point-of-Sale applications using the AVEAL 210/220. An iPad based skin care consultation suite, that combines questioners and measurements (using a bluetooth connected MFi+iAP measurement device), to provide an end-user with a skin type description. The goal is to provide a smooth and fast interface, with intuitive data visualisations.

App Store link: https://itunes.apple.com/us/app/aveal/id674486824

Sylton (InnoFaith) product information: https://www.sylton.com

TU/e – Genome visualisation (Master Thesis)

Graduation project at the Visualization Group of Eindhoven University of Technology, with the goal add genome size data support to the existing DNAVis2 sequence browser. The basic DNAVis2 sequence browser is an OpenGL accelerated visualization tool to visualize and explore a small number of annotated DNA sequences. The application is written in Java using the NetBeans framework and the JOGL OpenGL bindings.

Genome visualization

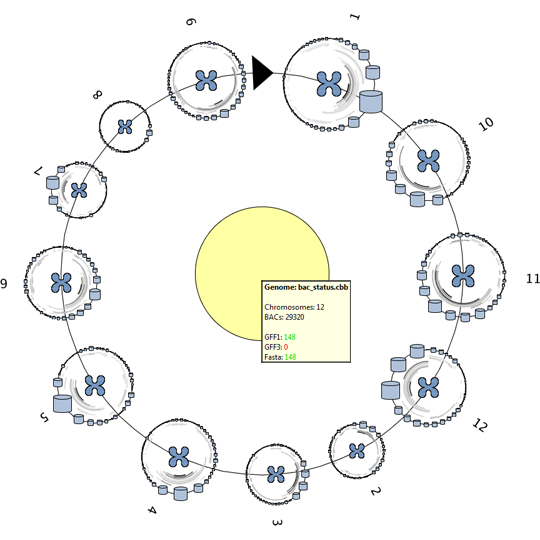
The extended version is designed and implemented during this master project and adds the data structures and visualizations needed to visualize and explore the data of a complete genome, consisting of 10.000-100.000 annotated DNA sequences. Two approaches are used to provide more inside into the dataset as a whole.

Chromosome visualization

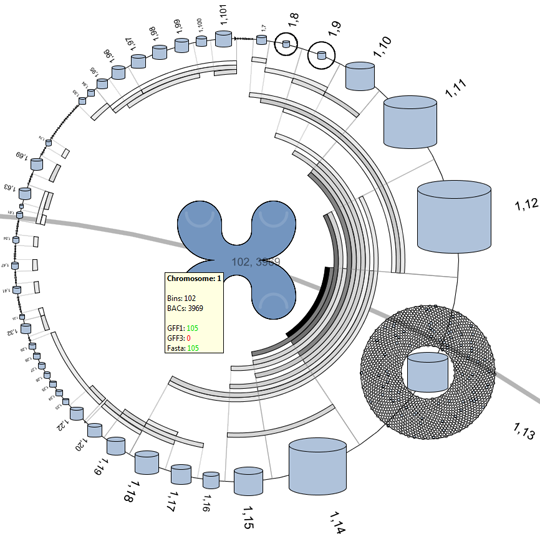
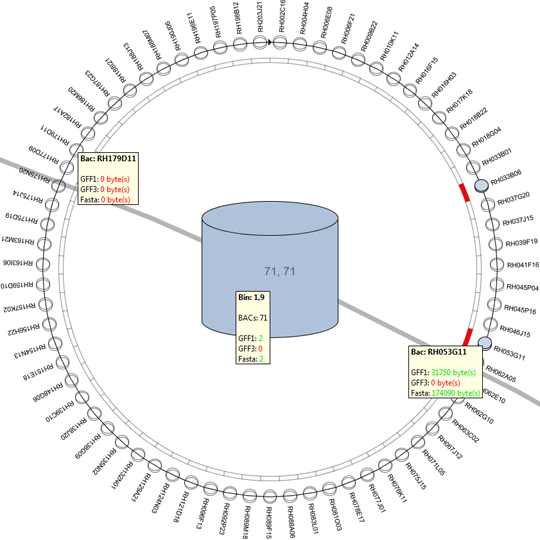
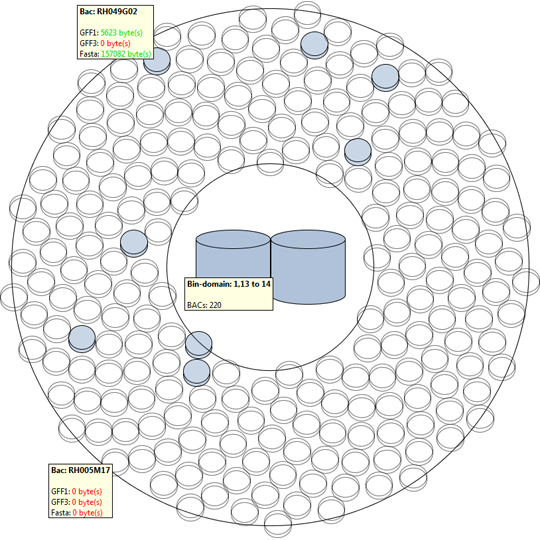
The first approach makes use of the higher level DNA structures to visualize the data distribution and to provide a high level interface to lower level annotations and sequencing data. This provides the biologist with the tools to browse and create sub-selection using the DNA’s structural properties.

BIN/BAC visualization

BIN/BAC visualization (Phi Ball)

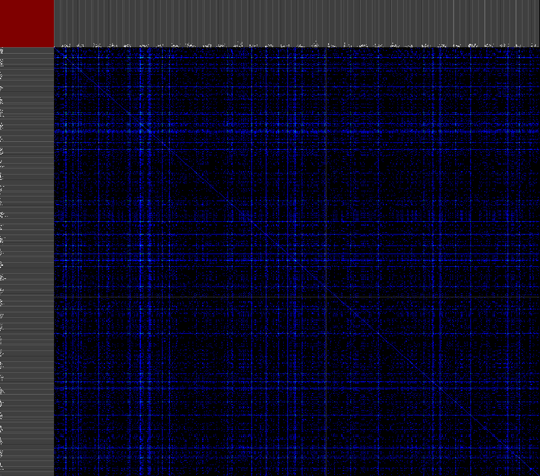
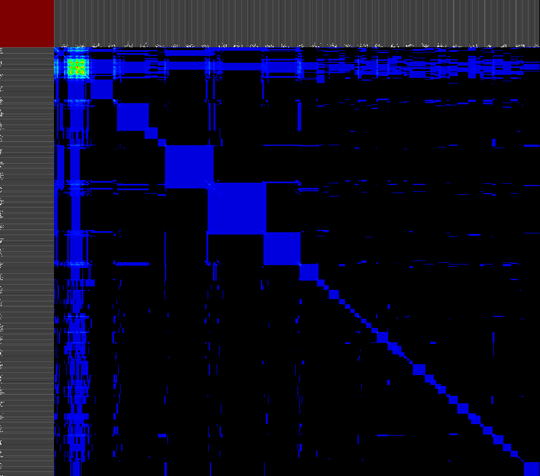
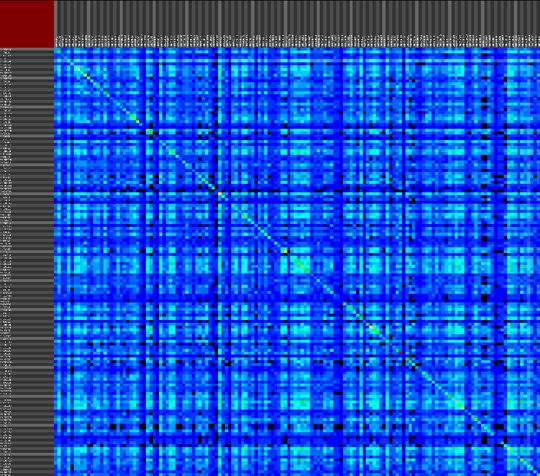
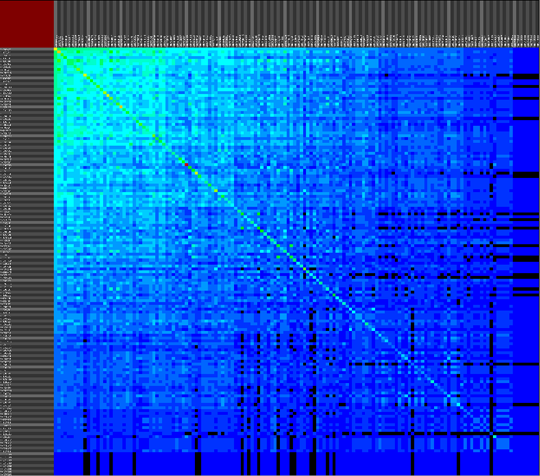
The second approach provides a versatile interface to cross-reference various data properties across all abstraction levels. This tool provides the biologist with an inside into the annotation data of the dataset as a whole (or a predefined sub-selection of the data), this results cross-reference visualizations than can contain more then 10.000 row and column items.

Cross-reference visualizations (Unsorted)

Cross-reference visualizations

Cross-reference visualizations (Unsorted)

Cross-reference visualizations (Sorted)

TU/e – Eyes tracking (OpenCV)

The face and pupil recognition application is the result of a computer graphics class, this application makes use of C99/C++ and the OpenCV (Open Source Computer Vision) library to find the face of a user and track his pupils using an inexpensive webcam. The idea it to calculate the viewing position on the computer screen using the webcam images. The resulting application was able to calculate a raw approximation of the screen location after small calibration procedure that uses 5 points on the screen (center, and all four corners). The application is also able to locate the user’s nostrils and mouth.

Eyes tracking

TU/e – Flow visualisation (OpenGL)

The flow visualisation application is the result of a visualization master class, this application uses a number of visualization techniques that are implemented using (OpenGL and C99/C++) to simulate smoke flow in infinite space. This application can visualize the smoke density, particle flows, and pressure areas resulting for a dynamically created smoke source.

Smoke flow visualization (partical trail)

Smoke flow visualization (noise)

Smoke flow visualization (density)

Smoke flow visualization (vector)