
Remko van Brakel, Mark Fiers, Christof Francke, Michel Westenberg, Huub van de Wetering
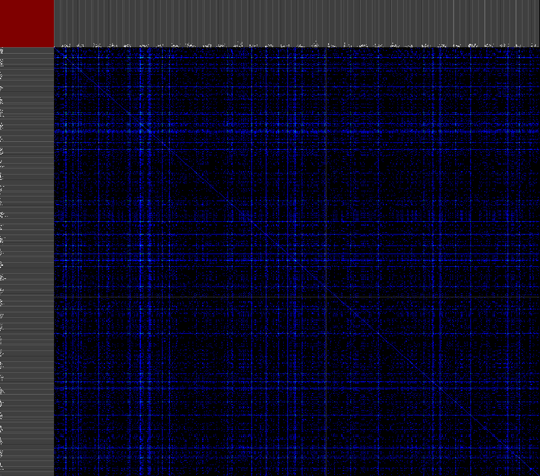
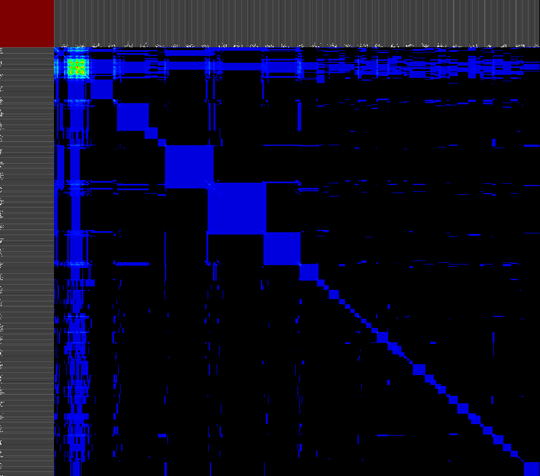
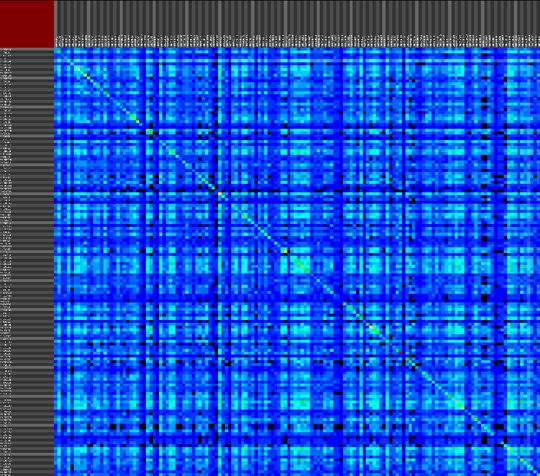
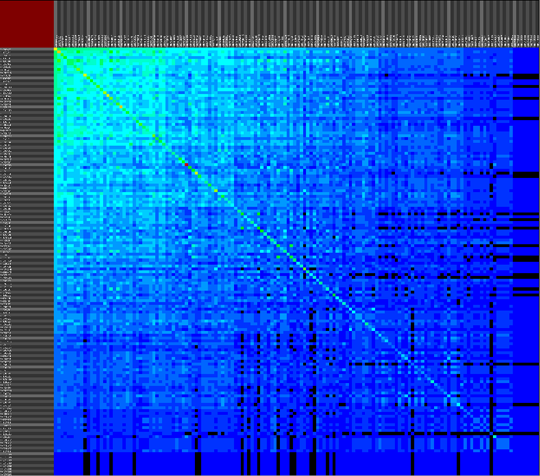
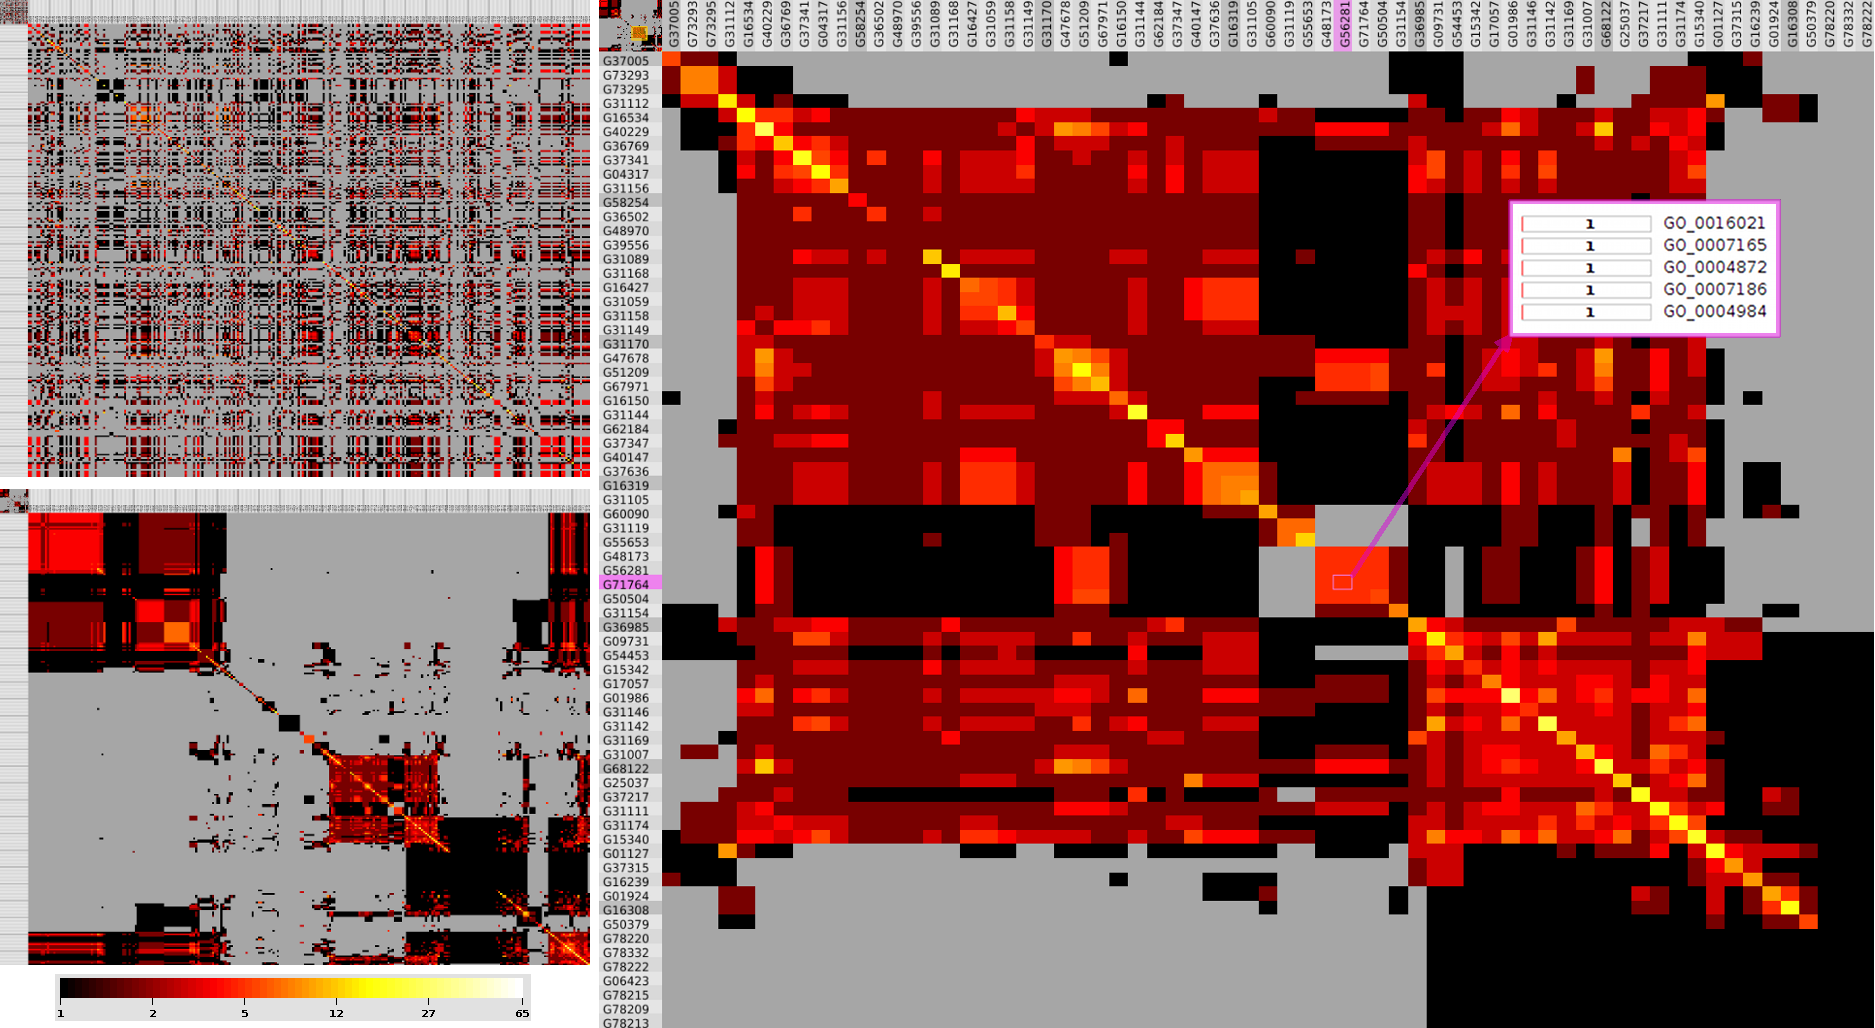
We propose a visual analysis approach that employs a matrix-based visualization technique to explore relations between annotation terms in biological data sets. Our flexible framework provides various ways to form combinations of data elements, which results in a co-occurrence matrix. Each cell in this matrix stores a list of items associated with the combination of the corresponding row and column element. By re-arranging the rows and columns of this matrix, and color-coding the cell contents, patterns become visible. Our prototype tool COMBat allows users to construct a new matrix on the fly by selecting subsets of items of interest, or filtering out uninteresting ones, and it provides various additional interaction techniques. We illustrate our approach with a few case studies concerning the identification of functional links between the presence of particular genes or genomic sequences and particular cellular processes.
Published in: Biological Data Visualization (BioVis), 2013 IEEE Symposium on
Recording of the COMBat presentation at BioVis 2013 by Michel Westenberg.