I got a cool home made Atari 2600 arcade as a Sinterklaas gift!
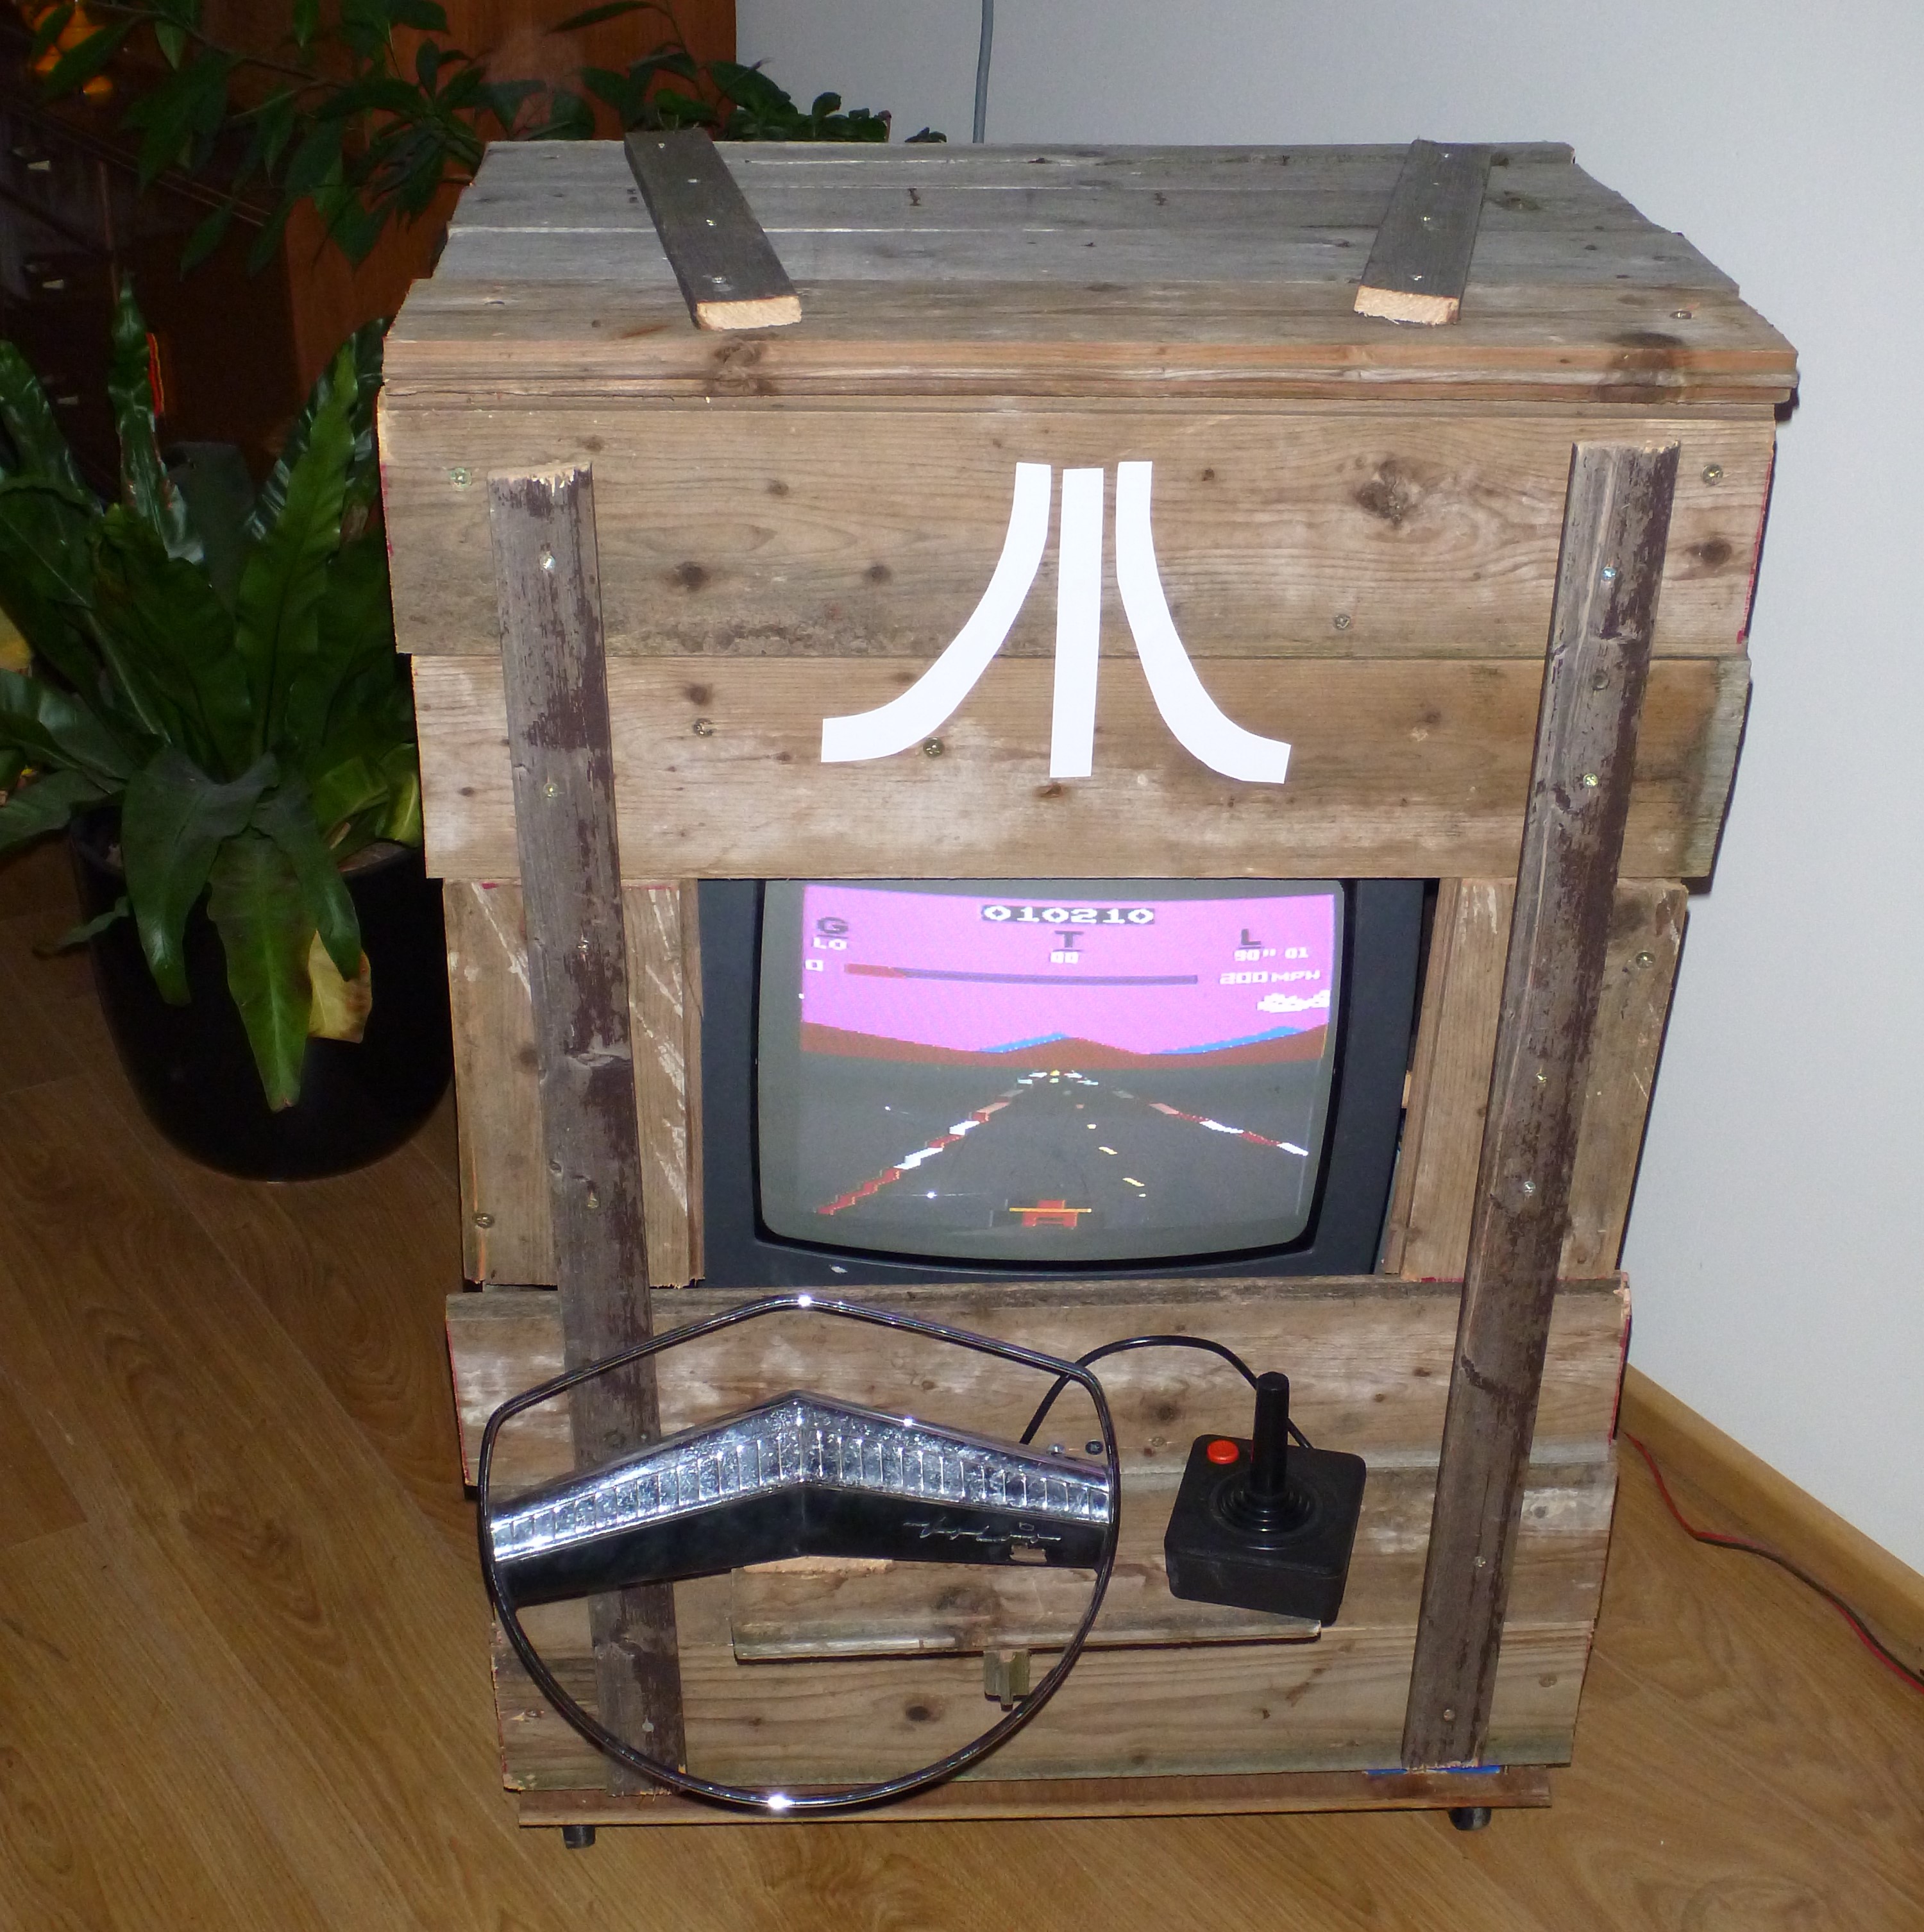
Will take it to my work (InnoFaith beauty sciences) to put it next to the coffee machine 🙂


Work in progress, as always…
I got a cool home made Atari 2600 arcade as a Sinterklaas gift!
Will take it to my work (InnoFaith beauty sciences) to put it next to the coffee machine 🙂
![]()
InnoFaith beauty sciences develops full-custom skin and hair diagnostic devices for the cosmetic industry and for the housebrand Sylton.
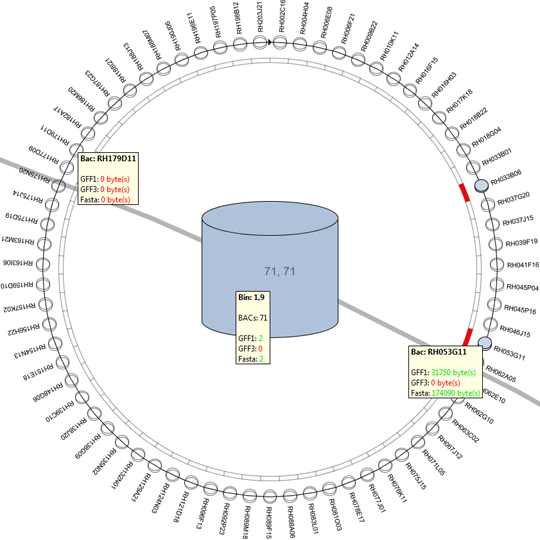
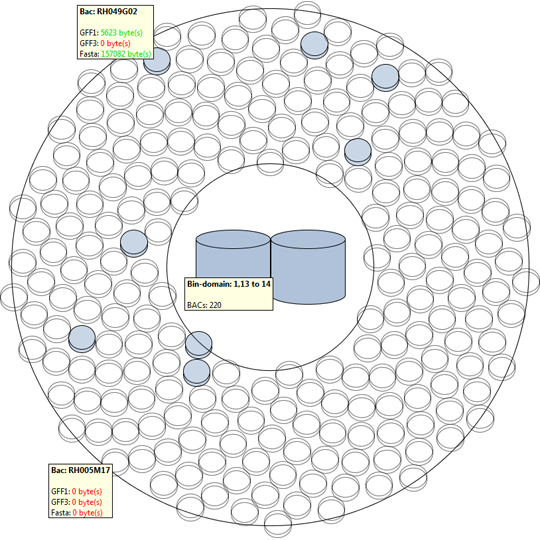
Graduation project at the Visualization Group of Eindhoven University of Technology, with the goal add genome size data support to the existing DNAVis2 sequence browser. The basic DNAVis2 sequence browser is an OpenGL accelerated visualization tool to visualize and explore a small number of annotated DNA sequences. The application is written in Java using the NetBeans framework and the JOGL OpenGL bindings.
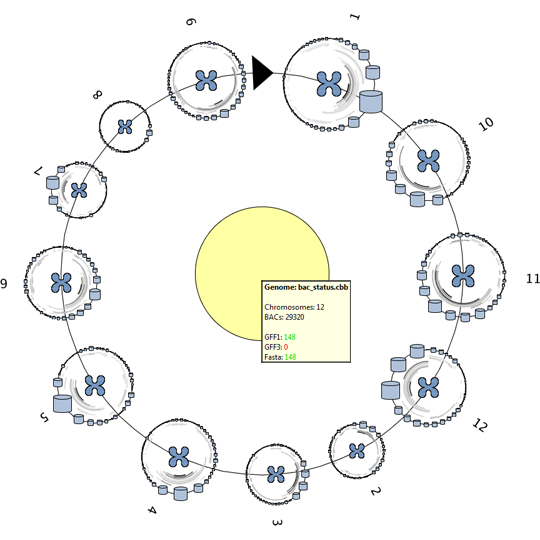
The extended version is designed and implemented during this master project and adds the data structures and visualizations needed to visualize and explore the data of a complete genome, consisting of 10.000-100.000 annotated DNA sequences. Two approaches are used to provide more inside into the dataset as a whole.
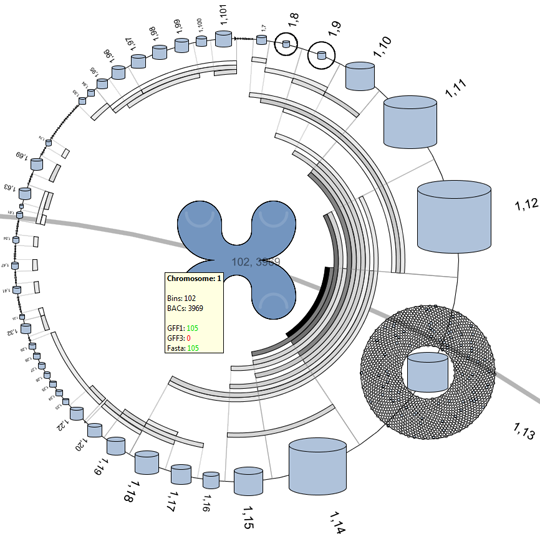
The first approach makes use of the higher level DNA structures to visualize the data distribution and to provide a high level interface to lower level annotations and sequencing data. This provides the biologist with the tools to browse and create sub-selection using the DNA’s structural properties.
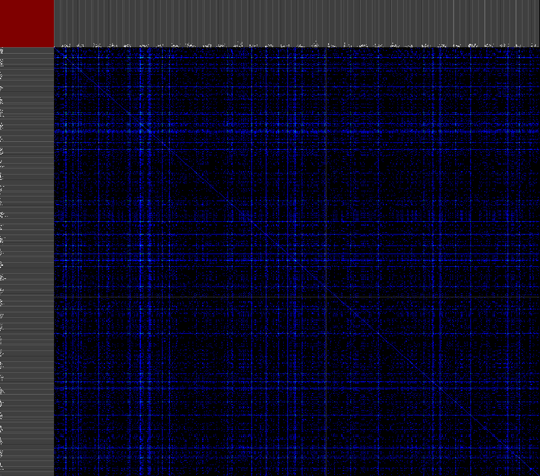
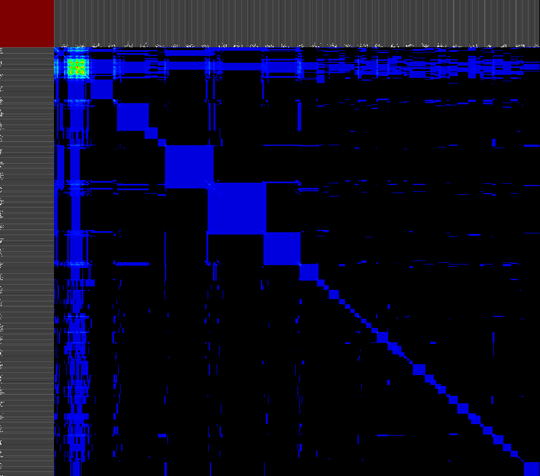
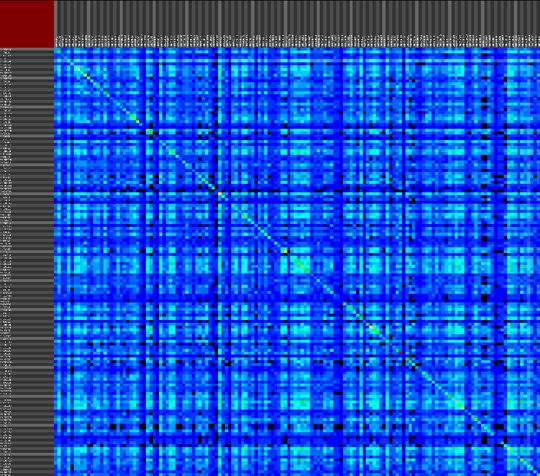
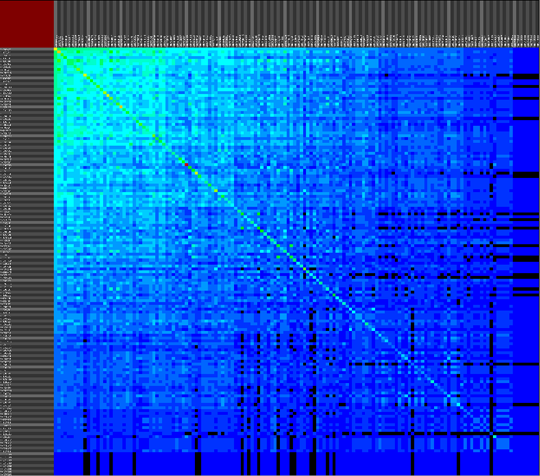
The second approach provides a versatile interface to cross-reference various data properties across all abstraction levels. This tool provides the biologist with an inside into the annotation data of the dataset as a whole (or a predefined sub-selection of the data), this results cross-reference visualizations than can contain more then 10.000 row and column items.
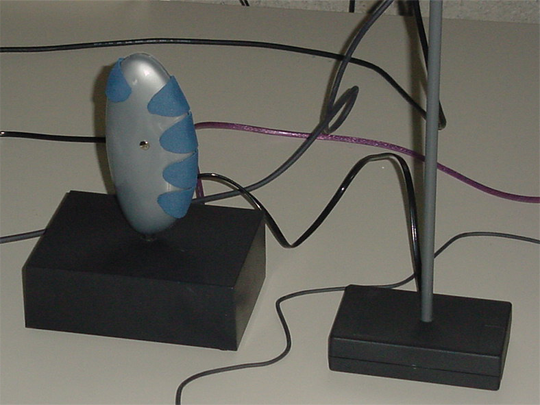
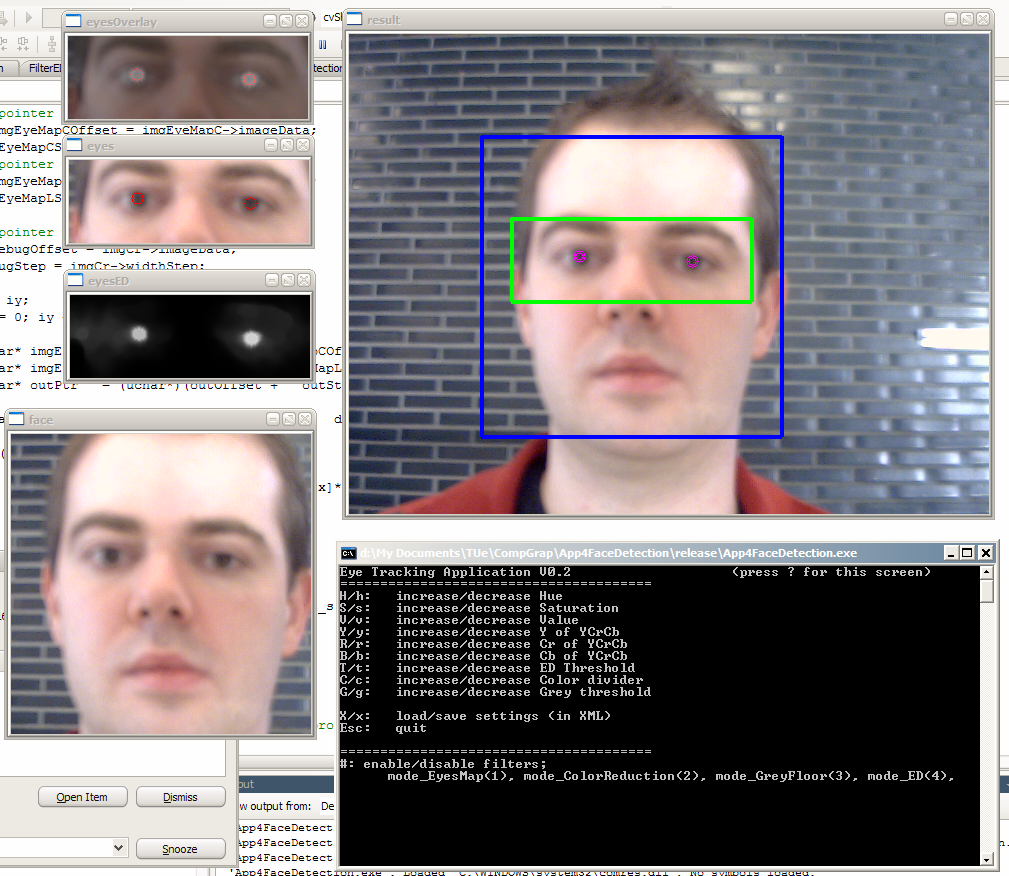
The face and pupil recognition application is the result of a computer graphics class, this application makes use of C99/C++ and the OpenCV (Open Source Computer Vision) library to find the face of a user and track his pupils using an inexpensive webcam. The idea it to calculate the viewing position on the computer screen using the webcam images. The resulting application was able to calculate a raw approximation of the screen location after small calibration procedure that uses 5 points on the screen (center, and all four corners). The application is also able to locate the user’s nostrils and mouth.
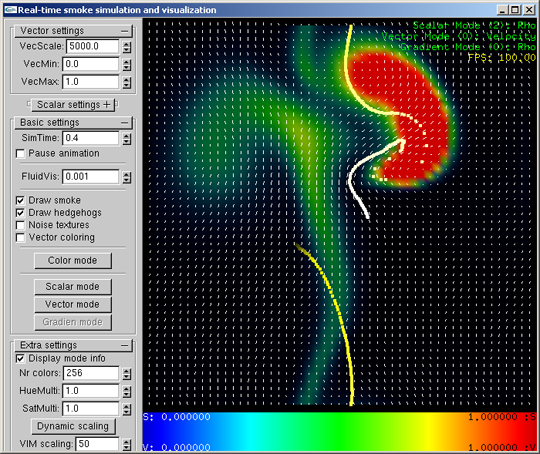
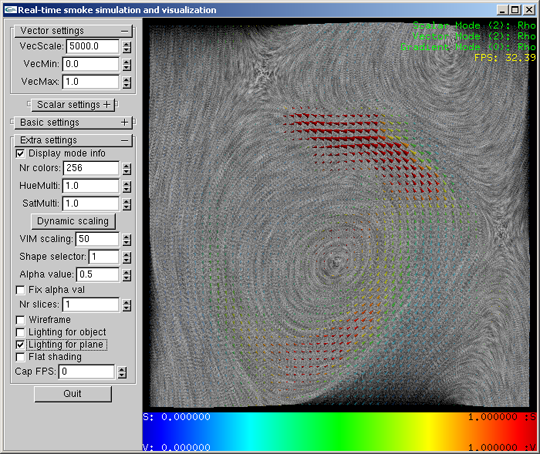
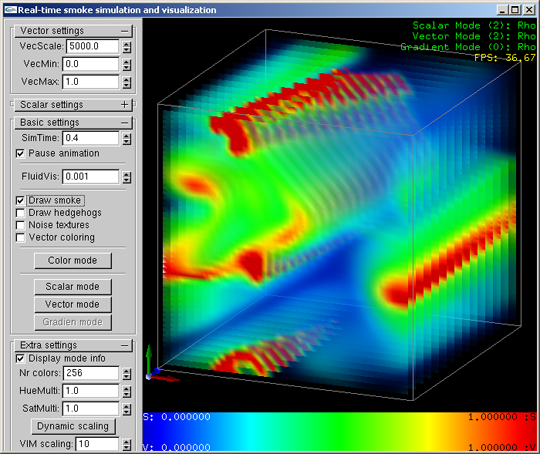
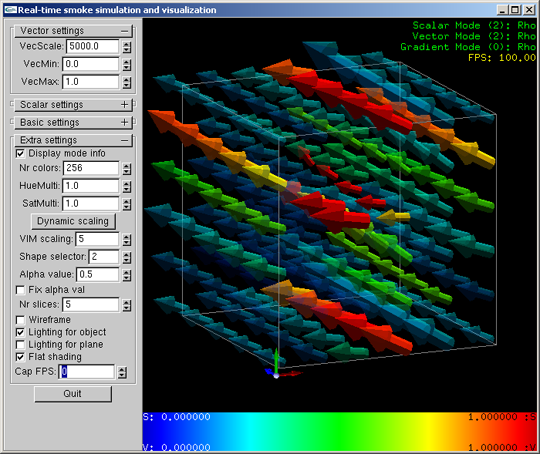
The flow visualisation application is the result of a visualization master class, this application uses a number of visualization techniques that are implemented using (OpenGL and C99/C++) to simulate smoke flow in infinite space. This application can visualize the smoke density, particle flows, and pressure areas resulting for a dynamically created smoke source.
Graduation project at Philips TASS (now TASS Software Professionals), with the goal to design and implement a FPGA based video encoder and decoder application using the Celoxica RC200 (Xilinx Virtex II FPGA based) development board and the Handel-C hardware description language.
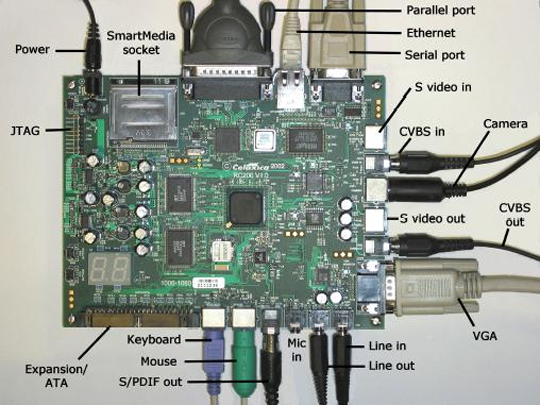
The FPGA video encoder and decoder are based on the RmaxCmax compression algorithm developed by Philips Research Laboratories. This compression algorithm uses discrete cosine transforms (DCT), like MPEG and JPEG. The algorithm transforms pixel blocks (of 8×4 or 8×8) into DCT coefficient blocks. The bit-planes of these DCT coefficient blocks (starting with the most significant bit-plane) are then compressed using zonal coding (meaning that only a small area of the bit-plane will be transmitted/stored). This data is then serialized in a way that the most significant data is transmitted/stored first. The resulting bit-string can be cut off at any length (to increase the compression), the remaining bit-string will produce the “best possible” image quality for the remaining data size.
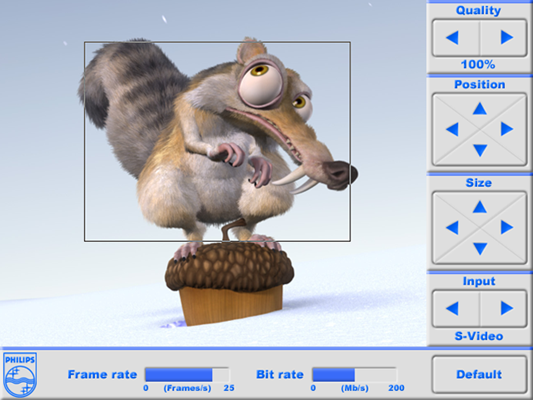
The graphical user interface (GUI) is programed within the FPGA itself, and provides the user with a fast and simple interface to view the encoding/decoding process and tweak the settings. The user can select a part of the video input, set the quality (read bit-rate), and can view the resulting decoded video output.
The wireless 3D game controller version 1.0 is the result of HBO project (pre Nintendo Wii era). The wireless game controller system uses four tilt switches and four AM signal-meters to determine the tilting position and location in 3D space of the wireless game controller. We liked to use accelerometers, but these were out of our budget.
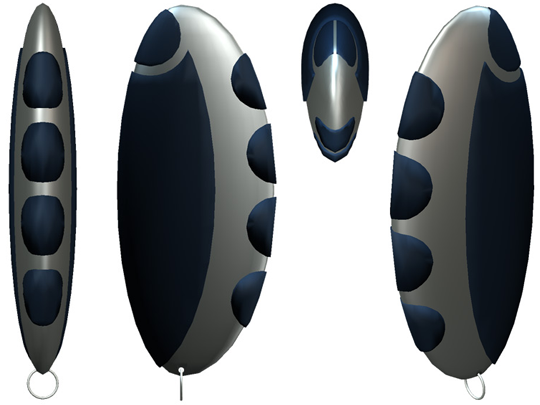
The game controller itself is build around an Atmel AVR ATTiny15L microcontroller combined with a 433MHz AM transmitter, four tilt switches, and four normal pressure switches. The microcontroller controller is programmed using AVR assembler, the program scans all the 8 buttons (4 tilt + 4 normal) and transmits a data frame with their status using the AM transmitter.
The base station contains an Atmel C51 AT89C5132 microcontroller combined with a 433MHz AM receiver, four AM signal-meters divided over two columns (every column has one signal-meter in the top and one in the bottom), and an USB1.1 connection to a PC. This controller is programmed using ANSI C, the program reads the data frame received from the wireless game controller, samples the signal-strength of the four AM signal-meters, and combines this information into a single USB data frame.
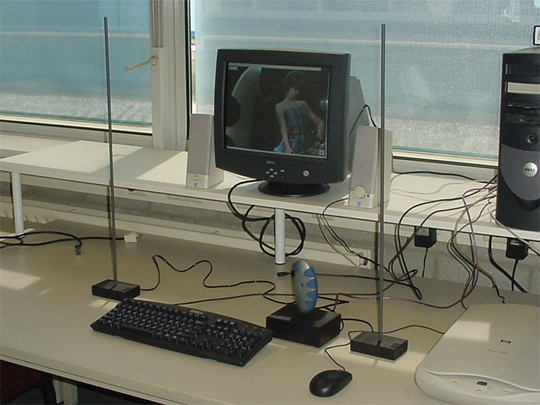
The PC reads the USB data from the base station using a small Delphi application, this application calculated the controller’s position using the signal strengths from the signal-meters, enables the user to calibrate the controller, and makes it possible to map virtual mouse and keyboard inputs to the controller inputs. This mapping makes it possible to use the controller in every existing application.